
Why ?
I have been working on the Tracy profiler a bit lately, and one of the performance issues is related to the retrieval of thread and process names. The way it currently works is that as soon as the profiler (GUI) receives information about a context switch from the profilee (your application, which is the one doing the profiling as it may be remote), it will query for the thread name, and the process name. The profilee will then query the OS for this information which may be a bit slow. Worse, the application/thread may have already died!
So instead of doing this, I thought of using the same tracing mechanism it already uses to get context switches information. On Windows it is ETW (Event Tracing for Windows), and I embarked on a journey longer than expected.
Please name your threads
Let’s start with this pet-peeve of mine. As I spend a lot of time in profilers and debuggers, thread names are kind of my north star. Naming your threads doesn’t take long, and really helps when doing any kind of analysis.
Sadly the C++ standard still hasn’t caught up with this more than 20 year-old feature of operating systems. Even though Corentin Jabot (thank you!) has been pushing for Thread attributes for many years now! Guess the committee prefers to focus on shiny new things over actually standardizing actual stuff that has been in use for ages. Maybe C++29?
Most languages and frameworks provide this functionality, but if you need a ready to use C++ implementation, here’s mine:
What is ETW?
ETW (Event Tracing for Windows) is Microsoft’s way of providing tracing and logging facilities. It is used everywhere, you can trace almost anything, be it from the kernel or Microsoft Word.
It is used not only for profiling, but also debugging and security purposes, as it can give deep insights as to what is happening on your machine.
You may have encountered .etl (Event Trace Log) files in the past, well, they contain mostly ETW events!
The main issue is… its lack of documentation. Or at least, of centralized documentation. Microsoft kind of expects you to only use WPR to record traces, and open them with WPA. While this works, it doesn’t help us consume such events for our own purposes. For that you need to use the event tracing API. It is not trivial to get working (see The Worst API Ever Made), but in reality once you get it working things get pretty obvious. I think one of the best resources for learning how to use it is Microsoft’s own KrabsETW. Even if not the best performance-wise, it covers pretty much everything.
That is… until you need to find what events you need and how their payloads are formatted! For that, you need to know a few ETW terms:
- Provider: A provider is a source of events, any application (or kernel subsystem) may register one or multiple providers.
- Kernel/User trace: Some traces contain sensitive information and are limited to Kernel traces. Those require administrator privileges!
- Session: This is an instance of a trace that listens to providers. The number of sessions are limited to 64, with at most 8 kernel sessions. There are always 2 that are reserved for the OS.
- Event: This is a single event that can represent many things depending on the source provider. Those always have some metadata however, and more importantly a timestamp. Each event is defined by a Task and an Id (usually called Opcode).
How to get thread names with ETW?
How you’re supposed to do it
For the Windows Kernel provider, you could start by looking at MSDN… until you realize it has not been updated since Windows Vista! And since there are a lot of events providers (1152 registered on my system!), which each provide a lot of different events… You need a way to get details about those easily.
That’s where manifests and schemas come in. A manifest contains the description of the various tasks (sometimes called keywords) and events, detailing their layout via a schema.
Sounds great, right?
But how do I explore all those manifests?
Well, that’s where things start to get tricky. WPR and WPA do not provide a way to explore those.
But Microsoft does provide other tools for that.
Actually, too many tools for that.
Depending on where you look, you might find mentions of logman, Wevtutil, TraceView, TDH and more…
However, most of those are commandline utilities, do not let you see the schema or are not very practical for exploration. Some are even tools that are either deprecated or almost impossible to download nowadays! (KrabsETW suggests using Message Analyzer which is not downloadable anymore.)
Then you learn about PerfView, but the download link points to a 404. But wait, it does still exist and you can find it on Github, awesome!
Or is it?
While you can browse the providers and the tasks, for some reason you cannot preview the manifest of the Windows Kernel Trace provider, which is exactly the one we’re looking for! (A button does exist, but does nothing for this provider.)
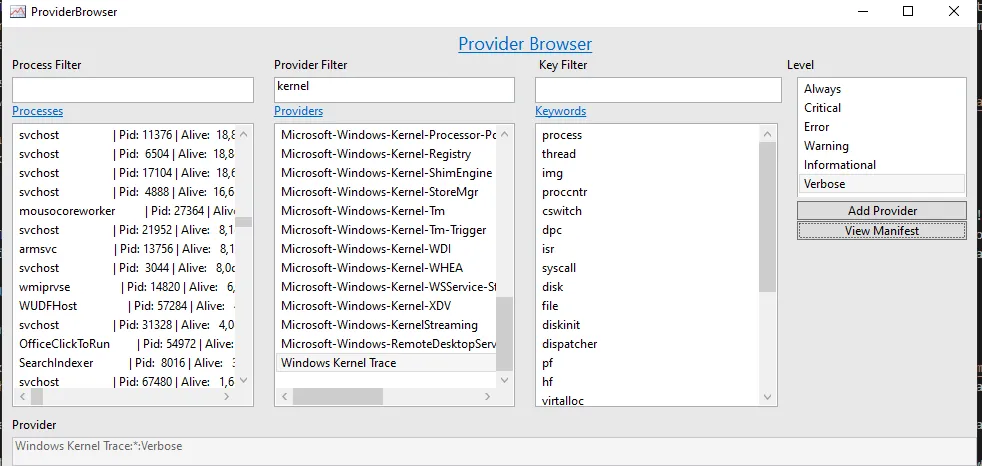
I was starting to think I would have to write a small utility to find what I was looking for, until I stumbled on EtwExplorer which does exactly what I wanted! With it, you cannot only list providers, but see details about the events:
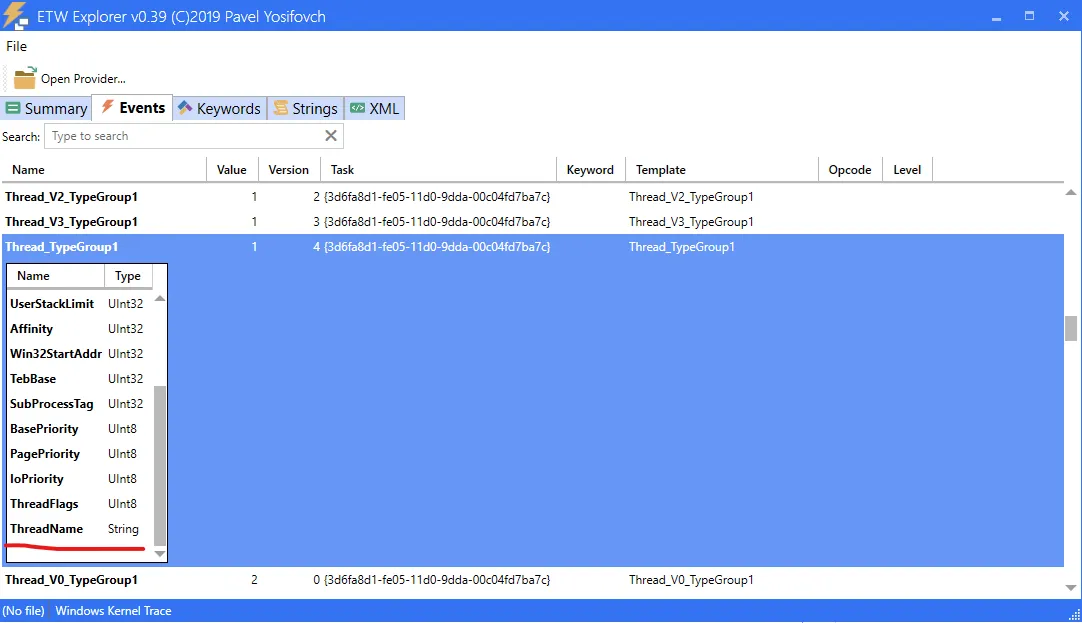
Finally, the golden grail!
I need the event from the Thread task of the Kernel provider, with opcode 1-4, which I already knew about. Those are the Thread Start/End/DCStart/DCEnd events.
The
DCvariants are rundown events emitted by enumerating all threads at the start and end of the trace.
Spoiler: Ackchyually…
Happy with my discovery I went ahead and tried to validate it by modifying the examples for quick iteration.
KrabsETW uses schemas to parse the results, and those are retrieved by using the TDH API.
This is convenient and good if you want to access values using names, which is supposedly more resilient since events (and schemas) are versioned.
threadprovider.add_on_event_callback([](const EVENT_RECORD& record, const krabs::trace_context& trace_context) {
    // Start/End/DCStart/DCEnd
    if (record.EventHeader.EventDescriptor.Opcode >= 1 || record.EventHeader.EventDescriptor.Opcode <= 4)
    {
        krabs::schema schema(record, trace_context.schema_locator);
        krabs::parser parser(schema);
        auto pid = parser.parse<uint32_t>(L"ProcessId");
        auto tid = parser.parse<uint32_t>(L"ThreadId");
        auto tname = parser.parse<std::wstring>(L"ThreadName");
        std::wcout << L"PID= " << pid << L"TID= " << tid << " Name:" << tname << std::endl;
    }
});
The results:
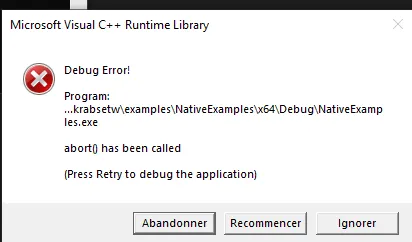
You may be familiar with this error message box… an assert was triggered. Probably a user error? I surely must have misused the library. The debugger points me to the origin of the error:
inline void throw_if_property_not_found(const property_info &propInfo)
{
    if (!propInfo.found()) {
        throw std::runtime_error("Property with the given name does not exist");
    }
}
Well… maybe I’m getting events from the wrong task or provider? Let’s check.
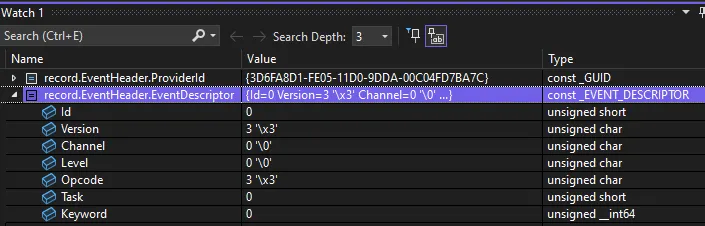
So, the provider is correct (the Kernel’s Thread task GUID is indeed 3d6fa8d1-fe05-11d0-9dda-00c04fd7ba7c), the opcode is correct 3, so the only thing left is… the version?
Wait, I’m receiving version 3 events?!
Let’s check their schema (MOF file generated by EtwExplorer from WMI):
[dynamic: ToInstance, EventType{1, 2, 3, 4}]
class Thread_V3_TypeGroup1 : Thread_V3
{
    [WmiDataId(1), format("x"), read] uint32 ProcessId;
    [WmiDataId(2), format("x"), read] uint32 TThreadId;
    [WmiDataId(3), pointer, read] uint32 StackBase;
    [WmiDataId(4), pointer, read] uint32 StackLimit;
    [WmiDataId(5), pointer, read] uint32 UserStackBase;
    [WmiDataId(6), pointer, read] uint32 UserStackLimit;
    [WmiDataId(7), pointer, read] uint32 Affinity;
    [WmiDataId(8), pointer, read] uint32 Win32StartAddr;
    [WmiDataId(9), pointer, read] uint32 TebBase;
    [WmiDataId(10), format("x"), read] uint32 SubProcessTag;
    [WmiDataId(11), read] uint8 BasePriority;
    [WmiDataId(12), read] uint8 PagePriority;
    [WmiDataId(13), read] uint8 IoPriority;
    [WmiDataId(14), read] uint8 ThreadFlags;
};
Wow, there’s no ThreadName! Which one was I looking at then? Oh damn, version 4…
[dynamic: ToInstance, EventType{1, 2, 3, 4}]
class Thread_TypeGroup1 : Thread_V4
{
    // All the same as Thread_V3_TypeGroup1
    // Then at the end:
    [WmiDataId(15), StringTermination("NullTerminated"), format("w"), read] string ThreadName;
};
Ok… something must be going on here. Because WPA can show me the thread names if I use WPR to record traces!
So I started to wonder:
Maybe the issue has to do with some missing option when starting the trace?
Or is it using some other event?
That’s when I learned about the Relogger API (aren’t you getting tired of all those new tools and APIs???)
This is the easiest way to read an .etl file (the ones I open with WPA), and it lets you replay the events of the trace, with the same strutures, and create a new .etl file with any of those. This effectively allows you to filter an .etl or inject your own events!
I decided to create a small test application that renames its threads to TestThread={PID}, then save a capture and check I can see those in WPA. Finally, I’d look for this name in all the events payloads instead of relying on the schemas.
static constexpr wchar_t stringTofind[] = L"TestThread";
static constexpr size_t stringTofindLengthInBytes = sizeof(stringTofind);
bool ContainsTestThreadName(const EVENT_RECORD* pEvent) {
    if (pEvent->UserData && pEvent->UserDataLength >= stringTofindLengthInBytes) {
        const wchar_t* data = reinterpret_cast<const wchar_t*>(pEvent->UserData);
        size_t wcharCount = pEvent->UserDataLength / sizeof(wchar_t);
        // Fortunately, std::wstring(_view) ignores the string null terminators and uses the actual size
        // so we can use it for the lookup
        std::wstring_view payload(data, wcharCount);
        return payload.find(stringTofind) != std::wstring::npos;
    }
    return false;
}
Full implementation here.
And I got a hit!
Looks familiar? Well this is the exact same event description than we had. Version 3.
So the payload does contain the string, but the schema doesn’t tell us that!
I decided to rewrite such events by replacing their names with another, and sure enough, WPA displayed the new names…
The manifest or the kernel is lying
The only possible conclusions are
- The manifest is lying and
Thread_V3_TypeGroup1should contain the thread name - The OS is lying and reports version 3 instead of 4
- This is an optional field and thus cannot be represented with MOF, as properties cannot be optional with this format
Manifests can be generated… or written by hand. And as usual with documentation, they can be incomplete or incorrect.
So what should we do?
Well, “When in Rome, do as the Romans do”. After a few hours of searching the internet, I realized that PerfView could also see those thread names. And its source code is online! How do they do it?
Well if you look at their KernelTraceEventParser.cs file it says:
/* This file was generated with the command */
// traceParserGen /needsState /merge /renameFile KernelTraceEventParser.renames /mof KernelTraceEventParser.mof KernelTraceEventParser.cs
/* And then modified by hand to add functionality (handle to name lookup, fixup of events ...) */
// The version before any hand modifications is kept as KernelTraceEventParser.base.cs, and a 3
// way diff is done when traceParserGen is rerun.  This allows the 'by-hand' modifications to be
// applied again if the mof or the traceParserGen transformation changes.
And this is exactly what happened for our ThreadTrace event… it was patched manually.
Since WPA and PerfView kind of are the source of truth and used in many places, kernel developpers will probably never break it. So in the end I ended up with the following code:
struct ThreadTrace // EventType{1, 2, 3, 4} Thread_V3_TypeGroup1 : Thread_V3
{
    uint32_t processId;
    uint32_t threadId;
    uintptr_t stackBase;
    uintptr_t stackLimit;
    uintptr_t userStackBase;
    uintptr_t userStackLimit;
    uintptr_t affinity;
    uintptr_t win32StartAddr;
    uintptr_t tebBase;
    uint32_t subProcessTag;
    uint8_t basePriority;
    uint8_t pagePriority;
    uint8_t ioPriority;
    uint8_t threadFlags;
    // The only difference between event types version 3 and 4 (at least, officially according to TDH) is the threadName.
    // But the OS seems to still provide threadName while reporting version 3...
    wchar_t threadName[1]; // Null terminated
};

/* ... */

if( record->EventHeader.EventDescriptor.Version >= 3 && record->UserDataLength > offsetof( ThreadTrace, threadName ) )
{
    SendThreadExternalName(tt->threadId, tt->threadName);
}
Conclusion
Documentation is scarce, spread everywhere, there are too many tools, it’s a mess. Now I’ll know to stick with two things when dealing with ETW: EtwParser + PerfView’s source code.
I didn’t detail the whole process of coming to this result but it was a real challenge, so I’ll stop this article here before getting PTSD. Hopefully this blog post will help someone else, but I know for sure it will help future me.